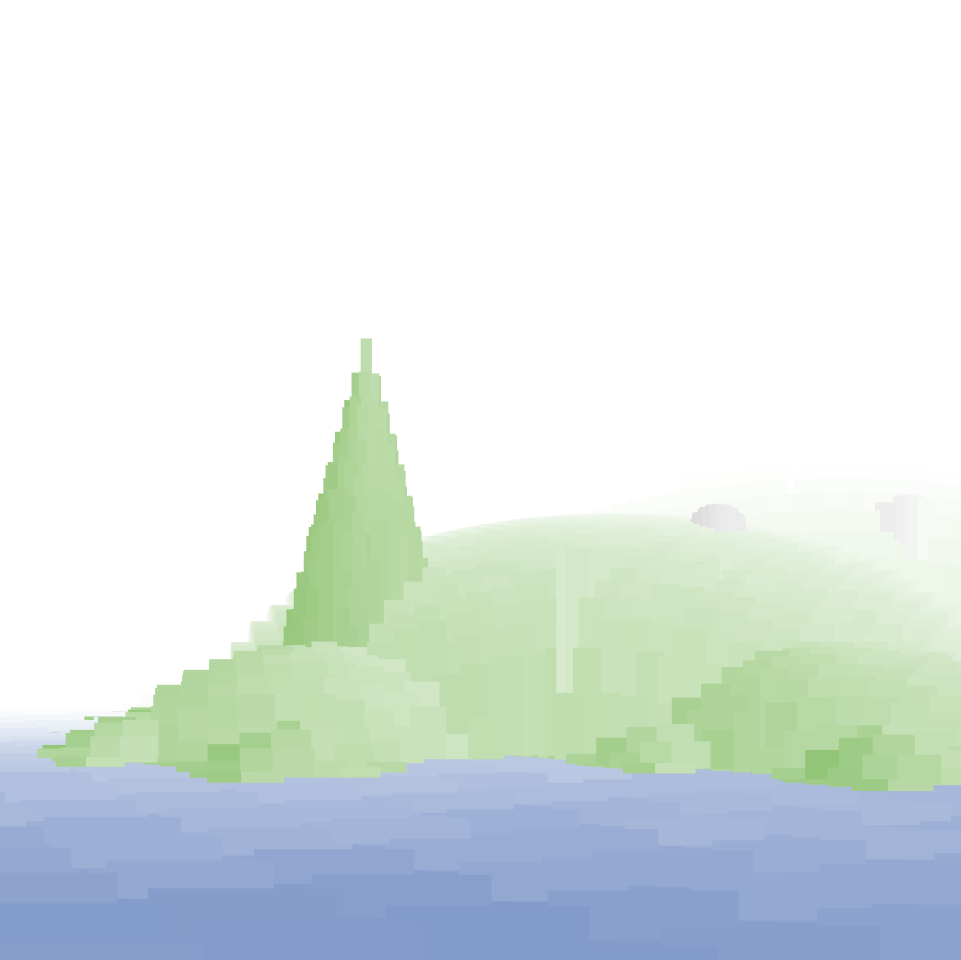
Though the final version of my js1k 2014 entry wasn't a potential winner with its visual glitches and poor frame rate, I had put some hard work into it, and had a lot of (mainly mathematical) fun exploring recursive data structures and optimizing graph traversal algorithms. I felt this research area was a great mathematical and artistical playground, especially in the context of constrained creative coding such as js1k, so I decided to continue on the same path to publish something really satisfactory for the 2015 edition.
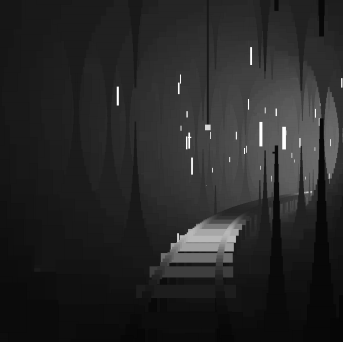
My 2013 entry proved that a few thousands well used coloured rectangles can bring a satisfactory pseudo-realistic visual experience. Canvas' fillRect is fast enough for the job, as long as it is backed by a powerful engine to keep the rendering loop is as simple as possible. The "Strange Crystals" demo used this technique in conjunction with old-school 2.5D techniques to simulate a first-person mine cart ride. The data structure was directly bound to the z-index and made the rendering loop dead simple, letting room to enhance the visual evocation with stalactites, lightbulbs and other goodies.
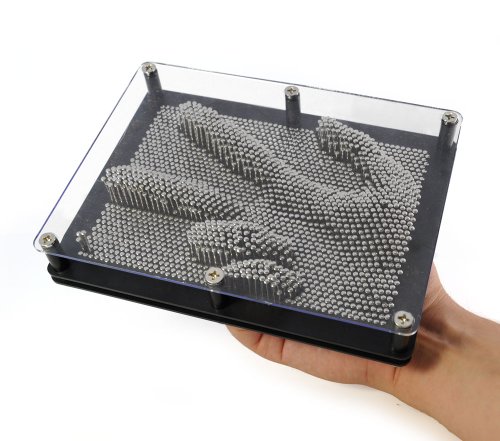
In 2014, I decided to go 3D by adapting the rectangle-based rendering technique to a heightmap. The idea was, given a terrain (altitude = f(x,y)), to tile the surface of the terrain, give each tile the height corresponding to the terrain's altitude at the center of the tile, and render the tiles with vertical rectangles to produce an approximate view of the terrain. When the tiles' width become smaller, the rendering gets more accurate and hopefully realistic. Pin art frames are a good real-world equivalent to this rendering technique.
The 3D rendering process must be able to perform standard tasks:
- View frustum : only the tiles that are in the view frustum need to be rendered.
- Perspective: given a point of view, apply perspective calculations when mapping the terrain coordinates to the canvas coordinates.
- Z-index: the distance between the tile and the viewer must be taken into account so that distant tiles do not overlap closer tiles.
Bonus features include:
- Variable level of detail (LOD): since distant zones don't need same rendering accuracy as closer zones, the rendering algo can profit from a multi-level tiling data structure.
- Memory efficiency: if some zones need less detail, the same layered data structure can help store sparse data in a more efficient way.
In the next post , I'll present the 2014 implementation of these principles, with its mathematical goodness and its inherent flaw.


